EF Profiler and investigating object context
Summary : EF Profiler worth his money !
Long Description :
I have finished a application with Entity Framework and POCO – and custom generated (.tt) files.
Now it was time to investigate performance – and it was a terrific problem.
How EF Prof helped me :
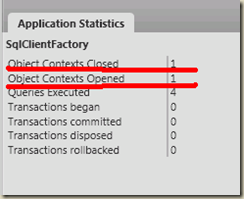
1. Displaying number of ObjectContext created and disposed in a Unit of Work and / or web page.
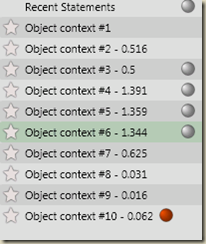
2. Displaying problem with the ObjectCOntext : using same context from multiple threads, alerts about code like here :
The red dot is about querying the database from the view. The gray one is about selecting a whole table without selecting top 1000 rows(OK, it was a dictionary table, like the list of countries)
3. When you want caching on your site , you can fast see this by seeing the difference between the number of queries and/or number of ObjectContext for the first time and the second one ( first time : 10, second time:2 or 0  )
)
4. See most expensive queries as time – usually this is a good option to put an index on the “where” columns.More , you can see also non-unique queries (that you perform more than 1 time)
5. Investigate easily all queries. Know what you want to optimize and where.
Improvements :
1. Say where is the ObjectContext that is not closing.
Alternatives:
How to: View the Store Commands : http://msdn.microsoft.com/en-us/library/bb896348.aspx
Sql Profiler : http://msdn.microsoft.com/en-us/library/aa173918%28SQL.80%29.aspx
(free ones :
http://sites.google.com/site/sqlprofiler/
http://code.google.com/p/sqlexpressprofiler/
)
But the job will be done by yourself!


Leave a Reply